FEATURE STORY

It’s All in Your Head
Ground-breaking research conducted by Dr. Linda Peterson provides remarkable insights into understanding
reactive hypoglycemia using electroencephalogram (EEG) technology.
Reactive hypoglycemia is one of the most complex and controversial conditions seen by practicing physicians. A patient might present as sociable, well-adjusted and clear-thinking one moment and crying, depressed or shaking the next. It is understandable that the clinician would diagnose the person as malingering or hypochondriac — perhaps even “crazy.”
The situation is complicated by the fact that these symptoms can occur hours after eating, so physicians don’t think to link diet to the behavior changes. Certainly, it doesn’t prompt them to consider a glucose tolerance test (GTT) to rule out a condition of low blood sugar. In the end, many clients find themselves referred to a “shrink.” They know they aren’t crazy, so they search for another medical opinion. This can go on for years with the same false diagnosis.
Eventually, the client might be told to get a glucose tolerance test (GTT). This test, however, can lead to another dead end if it’s given over a six-hour period (with blood samples taken on an hourly basis) and if the client is left alone without observation. Unless someone is watching for a change in symptoms as blood sugar concentrations change, the clinician will use the arbitrary blood glucose reading of 45mg% as a designation for a hypoglycemia diagnosis. After a grueling six hours of tormenting symptoms such as sweating, blurred vision and even passing out, the client will hear the physician say, “You have a normal glucose tolerance test!” How many of you have experienced such a moment?
The research I want to share with you had similar humble origins. I began to experience unusual fatigue, blurred vision and difficulty with balance while teaching in the Department of Pediatrics at University of Nevada, Reno Medical Center. It got so bad that I fell down the stairs from my office on the way to teach medical students. I made sure to take precise notes with me to class, fearful I would lose my train of thought mid-sentence. For three years, I had perused over five different medical centers in this country trying to figure out what was wrong.
The symptoms would come and go. I would feel lucid and calm in the morning but spacey and out of it by mid-afternoon. Finally, while at Stanford Medical Center, I was advised to get a GTT. Fortunately, on that trip, my colleague Dr. Bill Hudspeth sat in on the six-hour test and saw me pass out at the fourth hour. We were sure we had found the cause of my symptoms. The next morning, we heard the doctor say, “Your GTT is normal!” We both knew something was wrong. We decided to pursue other diagnostics in the Neurophysiology lab at UNR. We reasoned if symptoms of dizziness and ataxia (impaired balance) could lead to unconsciousness, the brain must be involved and might tell us more than a simple blood test.
The design of the study — which would ultimately become the Neurophysiology of Hypoglycemia — began with three simultaneous tests: blood glucose using the glucose tolerance test (GTT), an electroencephalogram test (EEG) and a radial pulse test. The clients we included in the study were not restricted to those who had already experienced symptoms associated with low blood glucose. The sample included people who had already had a GTT and those who were never tested but experienced symptoms associated with diet. Many had been ruled out as physically “normal” by their physician workup.
All clients were advised to eat a high carbohydrate diet for three days and come to our lab the morning of the fourth day. They fasted 12 hours the night before and were told to abstain from coffee or food before getting a baseline of their blood and EEG. In those days, clients were hooked up to 16 leads for the EEG and an indwelling heparin lock catheter for blood collection. They were questioned about their symptoms, given a list of possible reactions that could occur over the six hours and told to let us know if they experienced internal changes (while we observed objective symptoms). Meanwhile, we checked their pulse to consider whether they might show decreased oxygen when blood glucose fluctuated.
One of the children in the study, Deke, drew the following picture to get a sense of what kind of grit it took to go through this test.
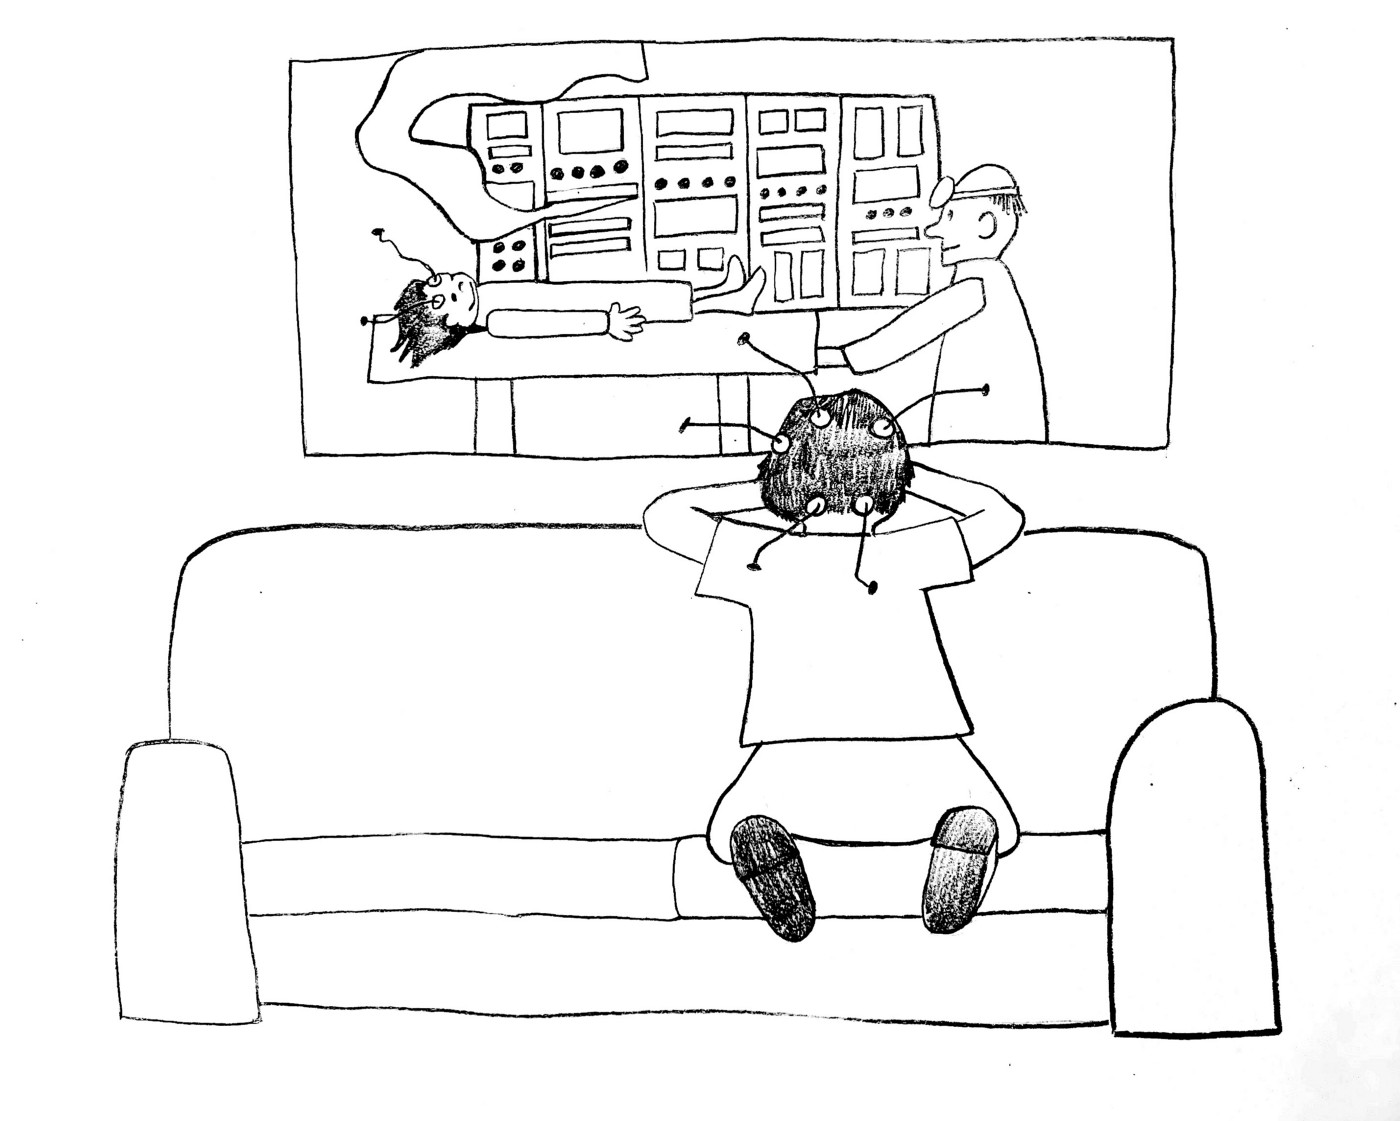
After watching a little girl through the window undergoing an EEG test, this 13-year-old boy asked: “What does that paperwork show that is coming out of the machine?”
I explained our research to Deke in “kid talk,” which I gladly share with you now:
“Good question, Deke! Some of the people here are having symptoms that their doctors think are all in their head. Sometimes they act normal and, sometimes, they don’t act normal at all. We’re going to use an EEG machine to monitor changes in their brain waves. The EEG is placed at different areas in the brain called the frontal, central, temporal, parietal and occipital areas.”
“Will they be putting sensors on my head when they do my EEG?”
“Yes, and the sensors or electrodes will measure brain-wave frequency. When the brain is normal, that frequency ratio is about 1.0-1.8. When the brain has a tumor, it shows numbers as high as 3.6 and 4.6 in the parietal and temporal areas. Remember these numbers because I am going to show you people with hypoglycemia who have higher numbers than people with a brain tumor!”
“Yikes. The docs might think they have a tumor, when really they might have hypoglycemia!”
“Exactly. These are individuals who went through the same test you are going through. When the day is over, we’ll see what your brain teaches us about you.”
“I sure hope it says I’m smart.”
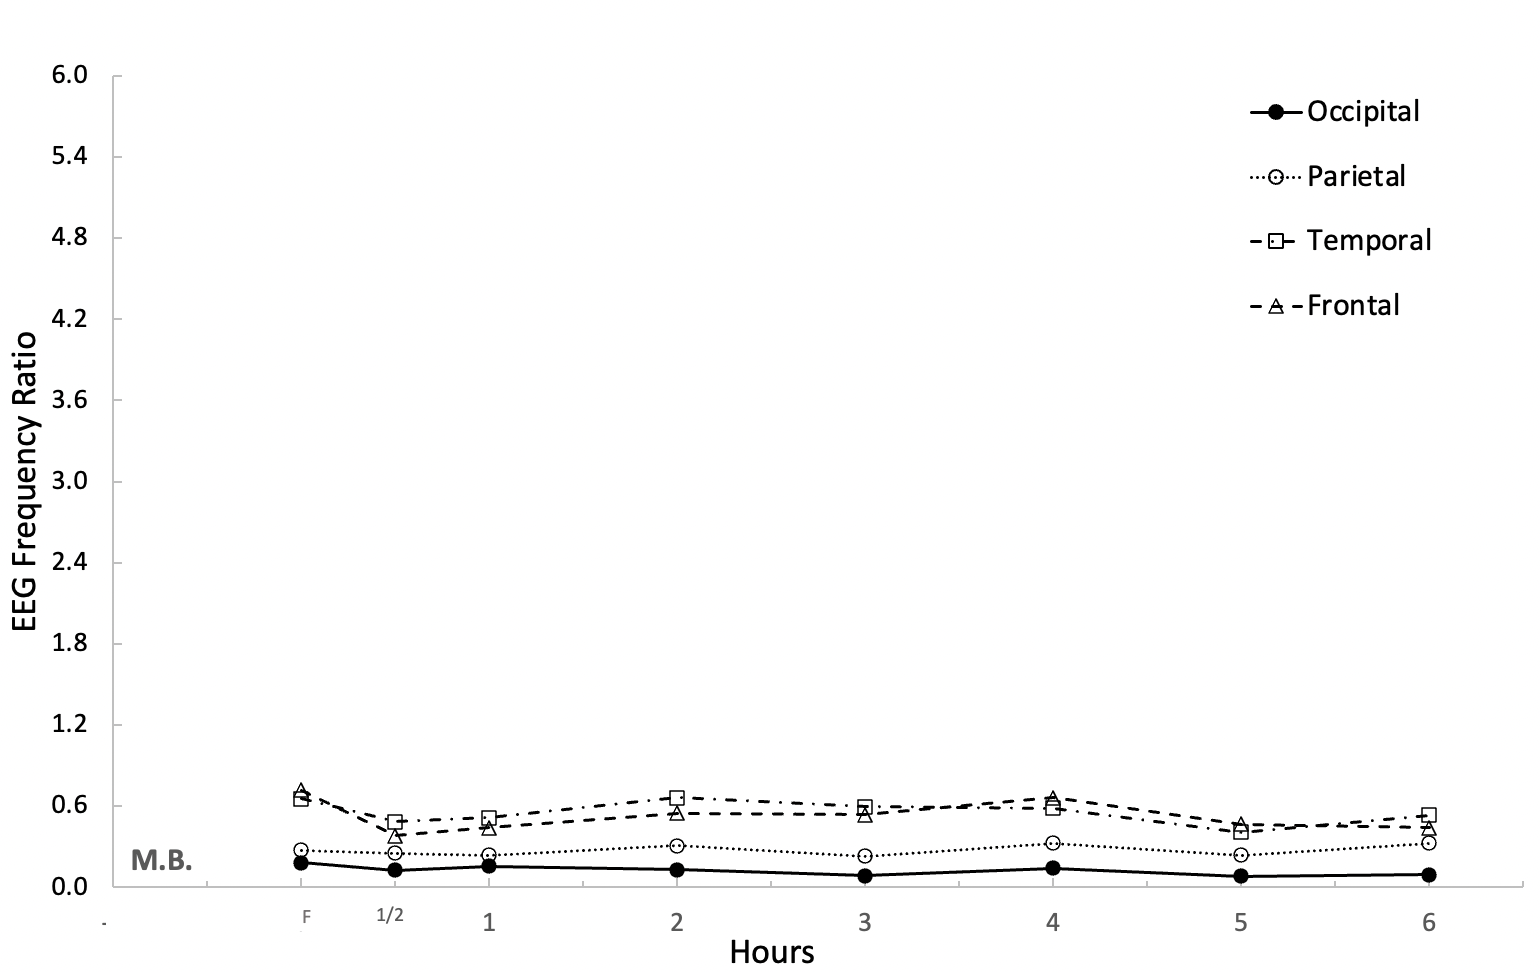
“I don’t need a brain scan to figure that out. Some of the people had a normal brain when we tested their blood sugar and their EEG. Notice that the numbers are all below 2.4 and there are no rises from the baseline for Patient M.B.”
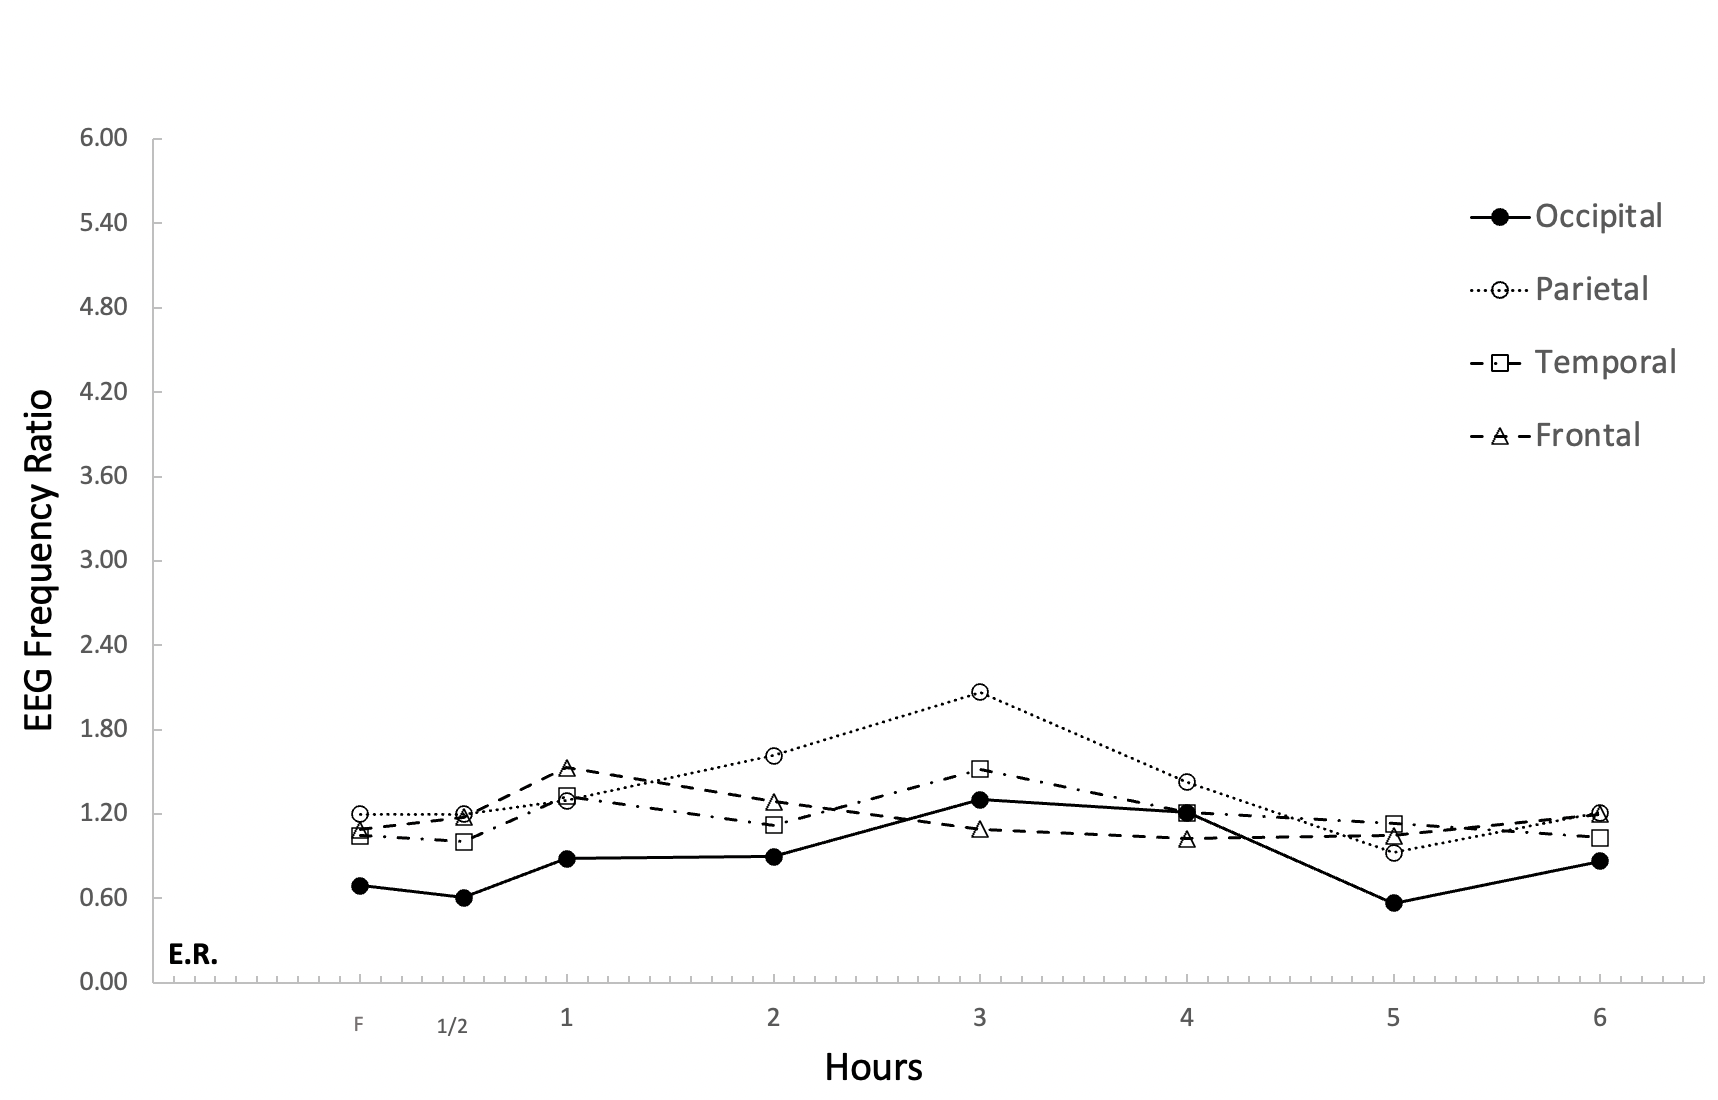
“Now notice a different result from Patient E.R. who, at the third hour, shows a parietal change that almost reaches 2.4, which we call borderline.
“Also see Patient P.R. who shows a borderline change at the fifth hour.”

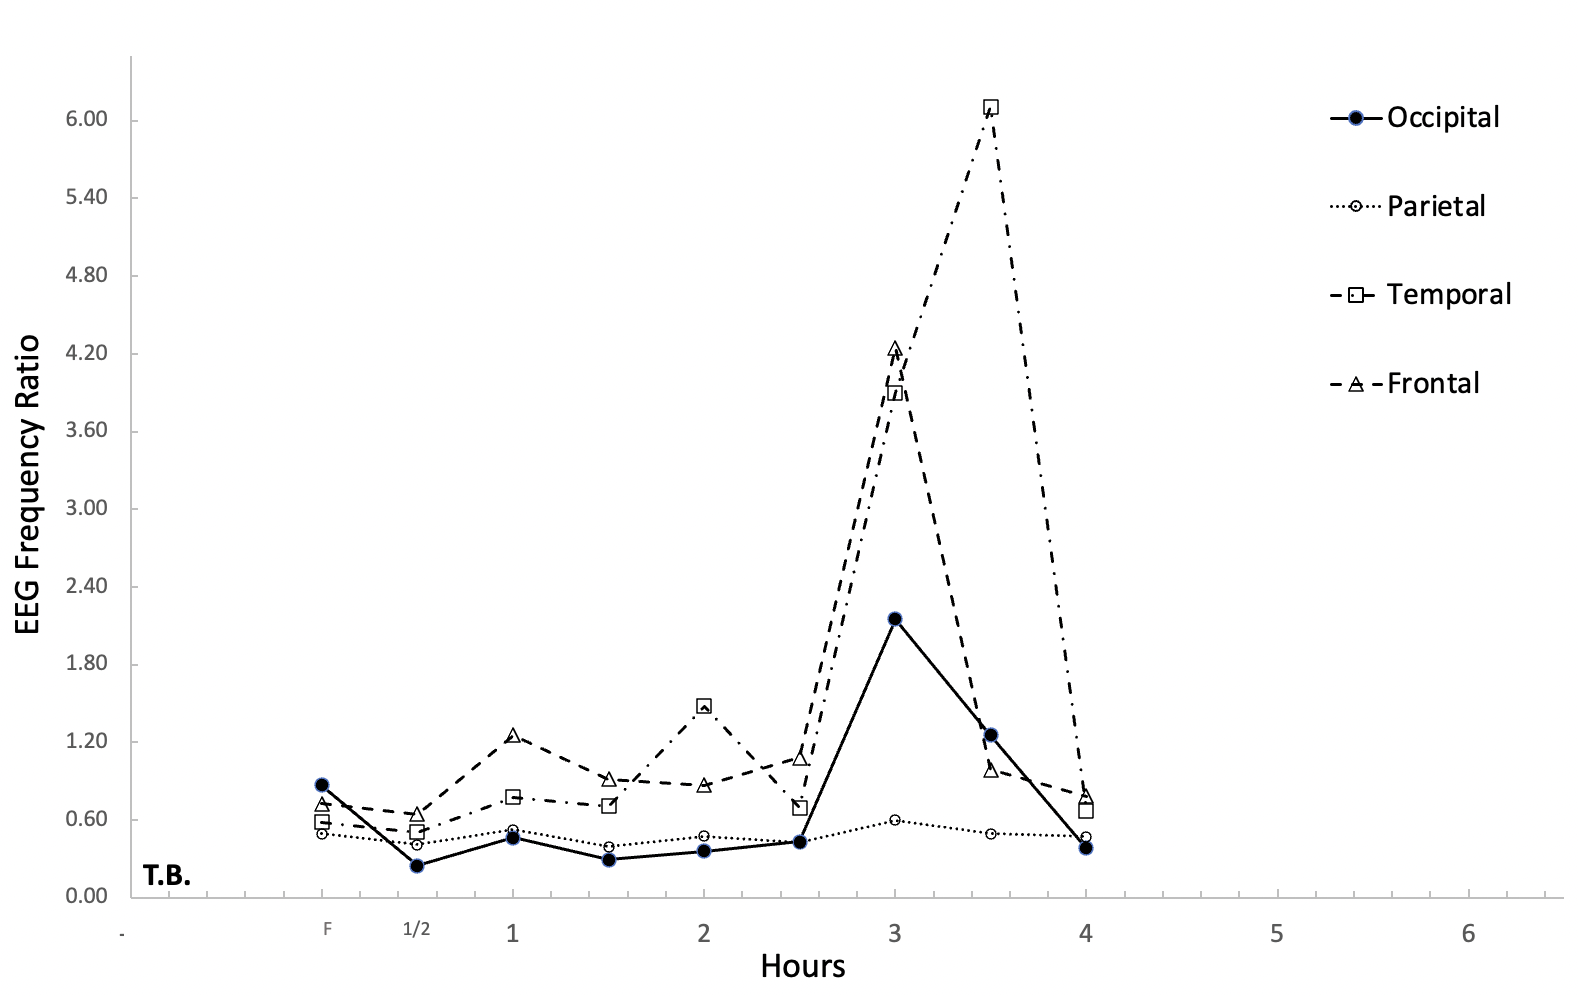
“But now look at Patient T.B. who shows a 6.0 change at 3-4 hours and has lots of symptoms. He was unsteady on his feet and needed two of us to walk him to the EEG.”
“This is cool! I feel like a real doctor!”
“Maybe you’ll be a doctor someday! If you look carefully, you will see his changes are in the temporal area, which is responsible for keeping us balanced. You will also see the frontal area, which is responsible for mood, is at 4.8. This man told us he was angry and afraid he would hurt someone else or himself during this hour and a half. By the fourth hour, he was relaxed and no longer sweating or swearing. This man had a high position in our state government and was described by his staff as the kindest or the meanest person they ever met, depending on the time of the day. His wife divorced him for physical abuse. His doctor thinks hypoglycemia is rare and self-limiting; that is, the doctor isn’t worried if brain changes only last 30–60 minutes because they go back to normal. The problem is that a lot can happen in 30 minutes, right?”
“Sure thing! Five minutes ago, I didn’t know half of this. Now look at me!”
“When Patsy, an ICU nurse came to our lab, she told us she was under a lot of stress and would often eat on the run or not at all. ‘I am really scared because there are times when my eyes blur and I can’t even see the monitors,’ she said. ‘Someone could die from me misinterpreting their monitor!’ She also experienced memory problems. ‘Last week, when I was giving out drugs to patients in the intensive care unit, I forgot which drugs I gave to who!’ she said. This is what her EEG looks like. What do you see, Deke? Is she normal or not?”
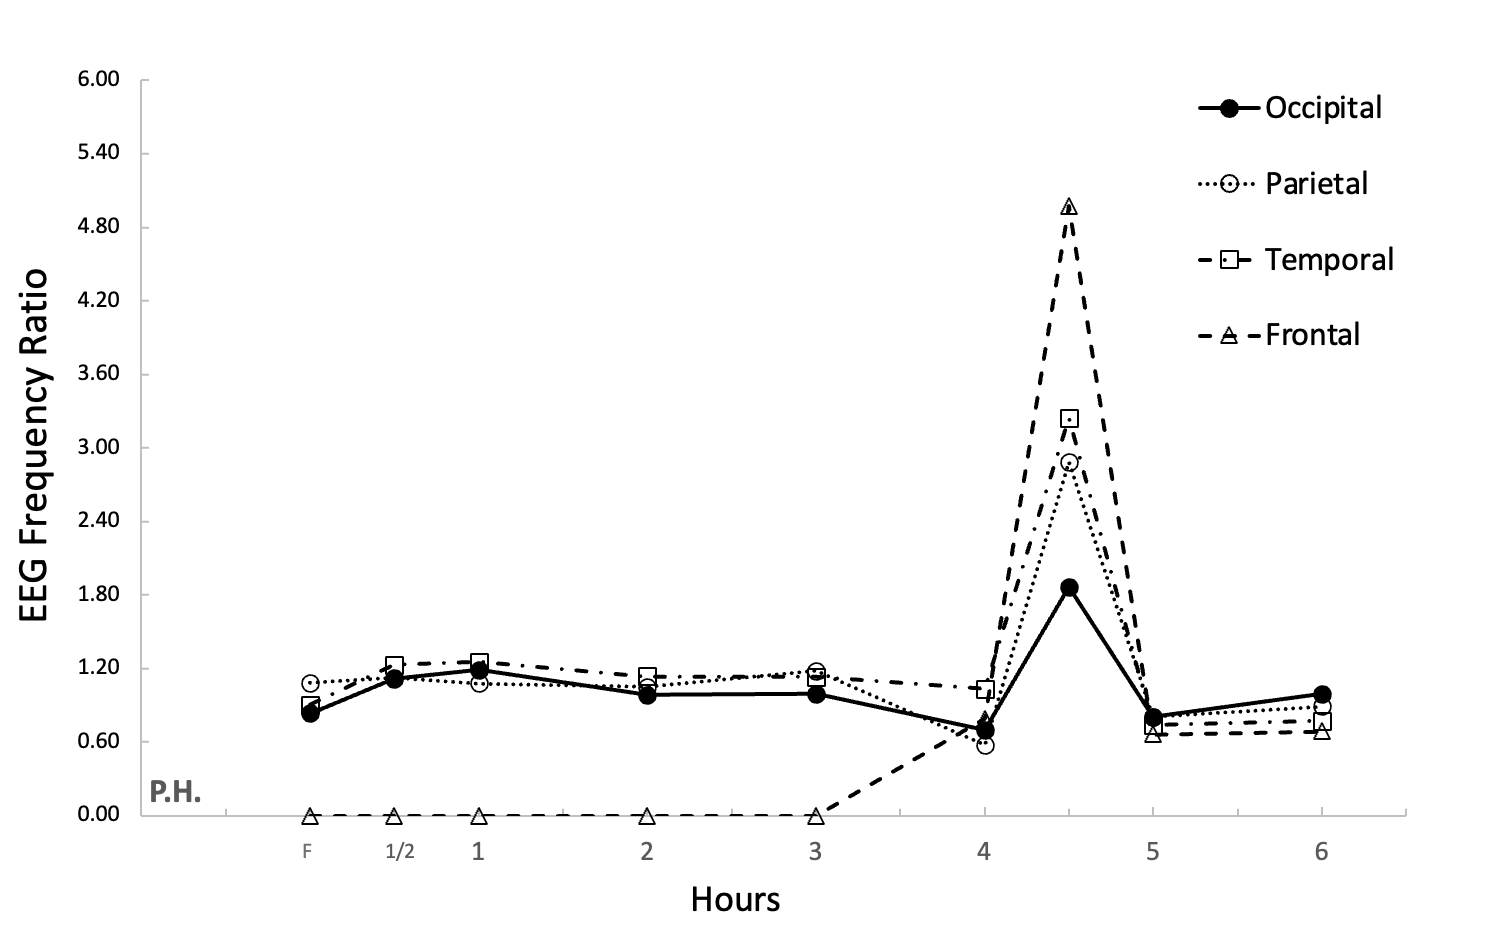
“No, she’s hypoglycemic. Look between the fourth and fifth hour!”
“Excellent, Deke. The last chart I want you to see is a 28-year-old accountant who had recently driven off Mount Rose highway. She didn’t eat breakfast and grabbed a candy bar for the car several hours before her accident. After a medical work-up, in which she experienced sudden body shakes, her physician sent her to a mental institution. She escaped that place and applied to our program. Notice on her EEG that changes occur at about five and a half hours. I noticed that one of her pupils was larger than the other. I asked Dr. Hudspeth to run the EEG at the half hour instead of waiting. The EEG showed deviation from normal to over 10 on the EEG frequency ratio, including seizure activity!”

“Back to your original question Deke, these are the things that the EEG paperwork is showing us. We are looking at what’s happening in the brain and, at the same time, taking samples of blood to see if blood sugar or insulin levels set off those brain changes. Everyone here hopes we find something physically wrong with them that they can fix rather than being called ‘crazy’ because their symptoms come and go. Everyone in the study serves as their own control. We look for blood and brain levels to start with and compare them to their own changes over the six hours. We call this single-subject research.”
“So, you aren’t comparing me to other people, you are comparing me to myself?”
“Exactly — and to the norms of people at certain ages. If we notice brain changes during the test, you can decide to change what you eat like cutting out white flour and sugar. You can also work on managing things that stress you out like school, parents and the like. When you’re upset or pressured, it affects your blood sugar and your brain’s response to what you eat.”
“So I’ve got to calm myself down!”
“Absolutely. Some people even learn to use relaxation techniques or mindfulness right after they eat. In other words, you can help your brain react less by changing your habits!”
“That’s good to know. But why are there little kids here?”
“One of the eight-year-old boys has been diagnosed with attention deficit disorder (ADD). His mom wants to see if he has hypoglycemia before she agrees to let him take the Ritalin his doctor prescribed.”
“What about the girl I watched in the EEG room?”
“That little girl is Susan. Her doctor ran lots of tests, even a one-time EEG and everything came out normal. He thought she must have a behavior disorder because he couldn’t find anything medically wrong with her. Susan was a straight A student last year. This year, she is falling asleep in class and can’t keep up. I found out her grandfather had hypoglycemia that was so severe he once was pulled over by the police for erratic driving.”
“I bet she might show one of the abnormal EEG patterns you showed me.”
“She might. Our results with kids show more scatter on the EEG, but they do still show an elevated EEG frequency if there is an underlying tendency toward hypoglycemia. We aren’t quite sure why this scatter is happening, but kids have a higher metabolism than adults and may already be showing brain changes after fasting 12 hours when they arrive at our lab.”
“Or maybe she sneaked in a cookie before coming in for the test,” Deke said, smiling sheepishly. “I wish I could have one right now!”
“After the test, I’ll get you a cookie made with almond flour and stevia. I bet you won’t even be able to taste the difference, but your brain will! Right now, you need to get to the EEG for another round of testing.”
“Now that I know there are things I can do if it turns out abnormal, I’m not as scared.”
“We’re all here, watching and monitoring you. You’ll do great!”
One of the prominent findings in the study was the unique pattern or signature of the GTT/EEG for each client. We initially followed the GTT protocol of testing hourly, but we saw profound physiological and psychological symptom changes at the half hour, so we decided to change the procedure. Our study took a new direction to include 30-minute EEG/GTT and insulin measurements for our clients. We also dropped the pulse measures as they were unremarkable. I had just read in the animal research literature that the half-life of insulin is 30 minutes. If people are not tested every 30 rather than 60 minutes, their EEG and GTT could completely miss a major finding. In addition, the animal research showed that when insulin is injected to an animal brain, water and electrolytes enter the brain, causing it to swell and dramatically change the electrical impulses. Was Susan a malingerer? No way. Her physiological symptoms had just been missed in previous workups and could have been missed in ours unless she was tested at a 30-minute interval. We too would have missed it if her eyes had not given clues to changes occurring in the occipital area of the brain. Watching client symptoms prompted us to develop a symptom list to check off while the patients undergo the six-hour EEG/GTT. Our last young woman became our primary proponent. She told everyone (including her doctor) that she found the cause and solution to her condition. Although the magnitude of brain changes only lasted 30 minutes, seizure-driven brain changes could have caused her to drive off the highway.
Subsequent to the initial doctoral thesis, we continued our research for several years. We began to closely watch which of the five types of hypoglycemia our patients demonstrated on the GTT. We found that people who had an alimentary (gastrointestinal) cause for hypoglycemia or a prediabetic GTT curve often had fluctuating insulin release that caused early and late EEG elevation. The high insulin corresponded more directly to the EEG changes and symptom changes than blood glucose levels. In fact, some clients had blood glucose that dropped below the 45mg% and had no symptoms nor EEG changes. Other clients, like myself, with the lowest glucose at 60mg%, had high insulin and symptoms as severe as unconsciousness.
These findings conform to the very early predictions of Dr. Seale Harris (1870–1957), who believed hypoglycemia is a misnomer for a condition called hyperinsulinism. In our work, only those with two types of hypoglycemia showed the pattern of hyperinsulinism. This finding led to publications by Dr. Hudspeth and myself for Holistic Medicine (1981). As I look back on the presentations of those clients who showed less dramatic results, I am aware that other factors, such as counter-regulatory hormones, could have been researched as well as GTT/EEG and insulin. This leaves open a field of investigation for epinephrine, growth hormone and cortisol at the present time.
The most obvious findings of our 1978–1980 studies showed:
- The GTT must be measured at 30-minute intervals, not hourly intervals, over a six hour period or significant client blood sugar/EEG changes may be missed.
- The EEG is a significant measure for the brain changes that can occur in people using glucose loading with GTT.
- The client symptoms are an important red flag to measure during the EEG/GTT. No one should be left alone during the study, as an outsider might see significant objective symptoms. Clients should have a list of possible internal symptoms to monitor over the course of six hours.
- Children should be tested for ability to read and concentrate (or other cognitive tasks) at baseline and later in their workup.
- The measure of insulin levels can show correlation to the EEG changes in persons with an alimentary or prediabetic hypoglycemia curve. The other types of hypoglycemic presentations — idiopathic, diabetic and transitional — should be investigated to extend the usefulness of measuring counter-regulatory hormones such as cortisol, growth hormone and epinephrine.
At the time of this study, we were unaware of any other studies that measured the EEG and GTT over a six-hour period. There were studies of insulin injection and a subsequent one-time EEG calculation, but not a measurement of the natural occurrence of blood sugar and EEG changes subsequent to glucose loading.
After we completed our research, Diana Fishbein, Ph.D., conducted a study using the EEG to analyze brain changes in response to different types of carbohydrates: glucose, sucrose, fructose and corn starch. Brain EEG changes and blood glucose levels were monitored over five hours, and the glucose and sucrose solutions were found to produce the greatest EEG effects. This suggests that sugar impairs brain regulation and mood stabilization more than simple starches and should be limited or avoided.
We were contacted by Dr. C. Keith Conner (1933–2017), the leading psychologist on ADHD and ADD at the time. He was concerned by our findings on the changes in children’s attention and behavior based on blood sugar alterations. Conners had not considered that what a child ate for breakfast might impact their behavior and concentration. As such, he enrolled 10 normal children aged 9–11 in a study to see how their behavior changed according to whether or not they ate breakfast. As the morning progressed, he found that the children not fed breakfast showed significantly more errors and lack of attention compared to those who had eaten. At the end of his study, Conners concluded that child attention and motor behavior are quite sensitive to subtle nutritional effects.
Science evolves over time, as we can see in the studies conducted after my initial doctoral dissertation. We also must consider the context of the times to better understand the full picture. I’d like to share some of that context with you now.
I recall the highly-publicized “Twinkie defense” used by Dan White’s lawyers in the 1979 murder trial of San Francisco city Supervisor Harvey Milk and Mayor George Moscone. The “Twinkie defense” alleged that some people who were being subjected to prison had a physiological cause for their violent acts. We were invited to present our research findings to those defending such clients.
Later, in 1988, the Board of Supervisors for the Department of Prisons in California requested we test three prisoners, now on probation, for the existence of transient brain dysfunction (TBD). We used the same 30-minute protocol for GTT/EEG over a six-hour period. We added a performance mental status test at each hour. This neurophysiological test contained twelve items designed to explore the integrity of major brain functions. Two of the three men tested showed significant EEG changes early and late in the six-hour testing period. As a result, we recommended widely testing prisoners for TBD. It is known that some persons who have grown up with poverty, neglect and abuse perpetrate violent acts, but others do not. Offenders, however, frequently a) report a history of learning disability b) perform poorly on specific tests of cognitive function and c) show deviant brain electrical activity. What if testing for TBD would factor out those who could be treated for a biological deficit, thus reducing or even eliminating their violence?
In the context of the times, another source of “white collar intimidation” should be mentioned. Through corporate control, members of General Foods attempted to restrain the publication of our findings. The executives were concerned that if the public really knew what excess carbohydrates and sugar do to the brain, it would impair their sales of sugar-coated cereal and other processed foods. Newly discovered documents show that the sugar industry paid scientists in the 1960’s to shape the debate around heart disease, sugar and fat.
The research on EEG and GTT is ripe for further investigation. Technology has advanced to the point that those suspected of TBD can easily be monitored in their natural environment. We now have ways to continuously monitor blood glucose and insulin. Soon, continuous EEG monitors will help us see how various factors impact our brain in real time. These tests should be considered a necessary rule-out before labels are applied to clients who present with symptom clusters used in the DSM5. Diagnoses such as ADD/ADHD, anxiety, depression, bipolar and transient violence episodes should not be made until practitioners have a clear understanding of the physiological state of the person. Practicing psychologists and mental health workers need to investigate each client’s habits of daily living, including food and sleep, to discover potential red flags.
The takeaway message from the EEG/GTT research is that there can be underlying physiological factors that significantly influence the perception and behavior of those who seek our help.
We are at a tipping point in our collective health consciousness. Thanks to groundbreaking education and technology, patients can now take charge of their own health and wellness journeys.
As for young Deke? He’s proof that practitioners can help patients understand what’s going on in their bodies, awakening “powerful inner resources for insight, transformation, and healing,” in the words of mindfulness expert Jon Kabat-Zinn. May we all take this sacred task to heart and help our patients truly heal.
Symptom Checklist for Clients
Physical: Trembling, sweating, weakness, drowsiness, fatigue, headaches, cold hands or feet
Psychological: depression, insomnia, irritability, restlessness, crying spells, inability to concentrate, memory problems, mental confusion, disorientation
Neurologic: headaches, blurred vision, fainting, vertigo, numbness, muscle twitching, tinnitus, ataxia (impaired balance), pupil asymmetry
About the Author and Researcher
Read another article by the author providing the fascinating backstory to the research by clicking here.
Linda W. Peterson-St. Pierre, PhD, RN, MSN, MFT
Linda W. Peterson-St. Pierre, PhD is an emeritus professor of Pediatrics and Family Medicine at the University of Nevada School of Medicine where she taught medical students, interns and residents from 1978-2004. At UNR, Linda wrote over 60 publications and a book while teaching nationally and internationally. She certified in the Intensive Journal in the 1980’s and certified as a Journal to the Self Instructor in 2009. She now conducts a clinical practice as a marriage and family counselor in Reno, Nevada. Linda works primarily with children and families navigating the chaos of divorce or emotional, physical, and sexual abuse. She has worked in the courts for over 30 years and is certified in mediation, collaborative divorce, and custody evaluation. Dr. Peterson-St. Pierre has been a consultant with the National Trauma and Loss Center for Children since the publication of her book: Children in Distress: An Art Screening Tool (1996). In 2010 she was awarded TLC Supervisor of the Year. She considers the TLC faculty her most potent inspiration.
Dr. Peterson wrote her Doctoral thesis on “Brain Neurophysiology in Persons with Reactive Hypoglycemia” in 1978 – her dissertation is so loaded with scientific evidence and insights that it is hard to understand why the medical community has yet to recognize her landmark work.
